
2026_08_22
Fine particle pollution in Luxembourg during High Fens fire (August 2026)
Starting the 14th August 2026, a very large fire consumed more than 3200 ha of forest and peatland in the Belgian National Park "Les Hautes Fagnes" ("Hohes Venn" in German). This was the largest forest fire in Belgium since 1911. Today (22 August 2026) it is contained, but there remains a great risk of zombie fires spreading in the peat underground.
In this blog, I will show how the PM10 readings went up at different measuring stations in Luxembourg, and also that it shows up in indoor PM10 measurements.
1. The Luxembourg Purpleair outdoor stations.
There are 2 outdoor stations equipped with Purpleair sensors in Luxembourg: one is in Bettendorf (manager: myself, Francis Massen), the second in Ettelbruck, ca 5km away, managed by my colleague Raoul Tholl. There is another station located in Ehnen (near the Moselle), but it is an indoor station and will not be included here.
The following picture is a screenshot from the website https://map.purpleair.com with a red circle added at the location of the High Fens fire:
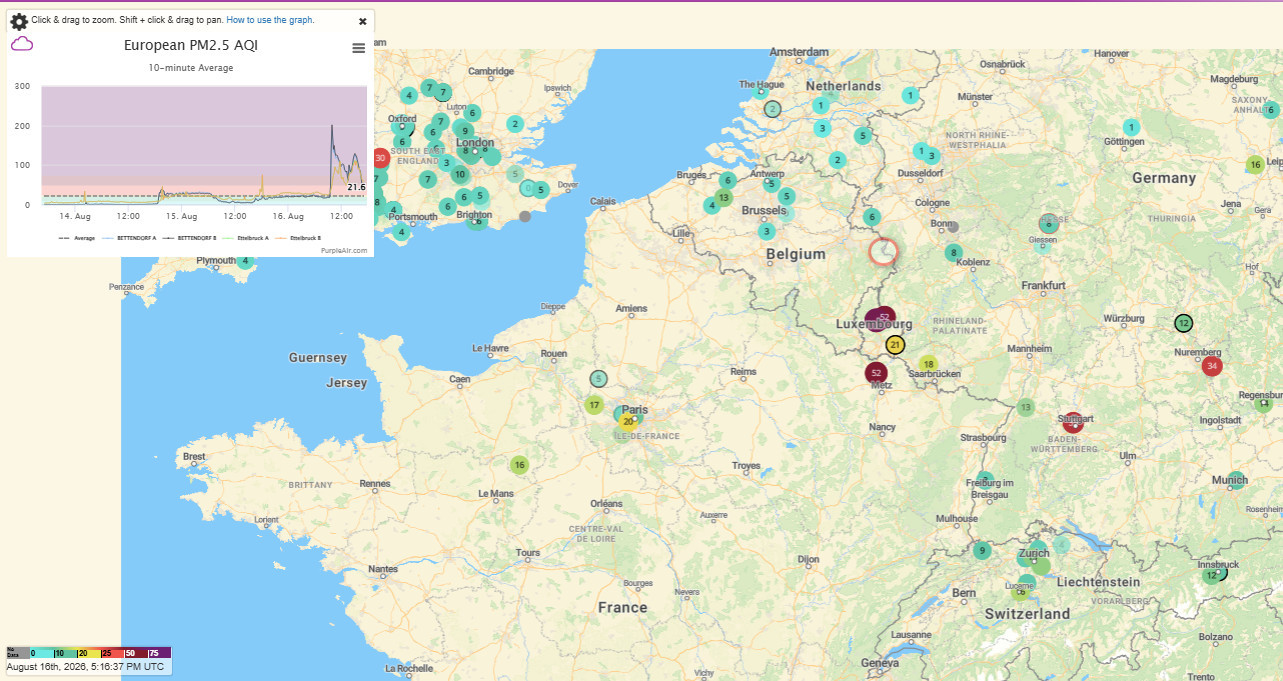
It clearly shows that the PM pollution (here PM 2.5) has reached South of the fire at least down to Metz. The black circle corresponds to the indoor station at Ehnen, that may also shown higher readings. Units are always ug/m3
The window at the upper left shows what will be seen as a first peak in Bettendorf (black) and Ettelbruck (yellow) starting before 12:00 UTC. The next screenshot has been taken the 17th August 2026 at 14:55 UTC; it clearly shows that the pollution has spread slightly to the East (see Saarbrucken reading), and most importantly, a very high peak has been recorded in Bettendorf in the late hours of the 16th August:
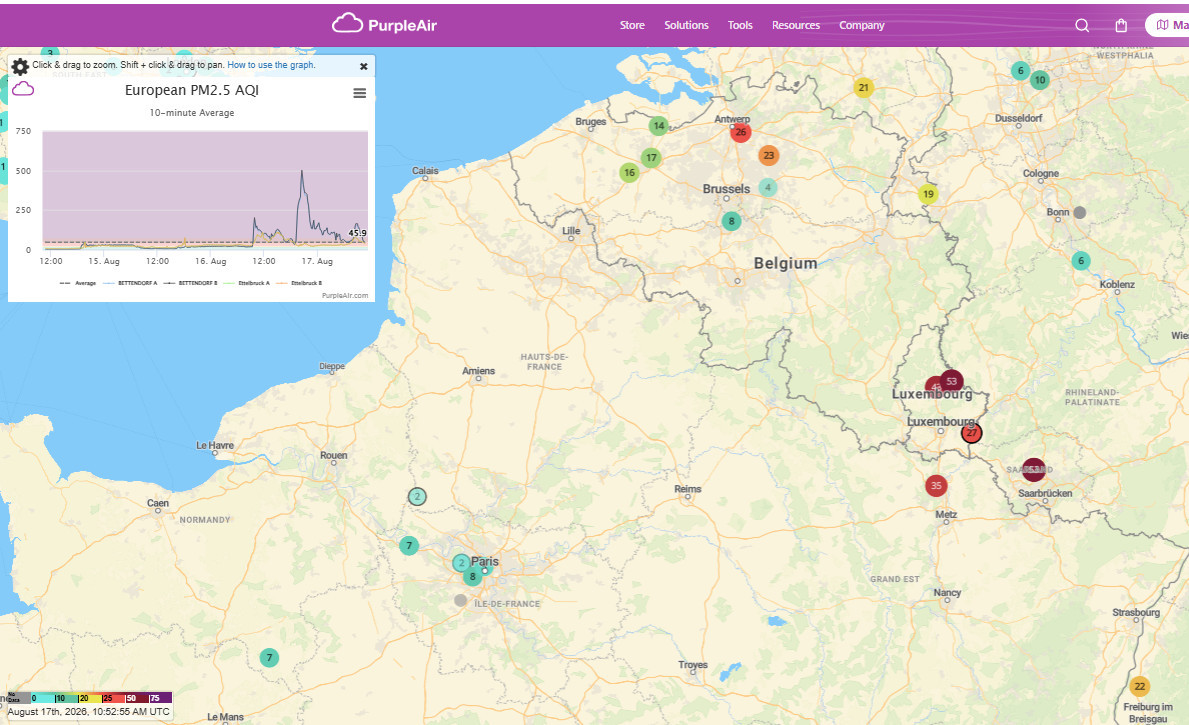
Curiously, that peak has not been read in Ettelbruck; this could be caused by a slight change in wind direction to the East, so that the plume did not touch Ettelbruck.
In Bettendorf, I also have an indoor Airvisual sensor running continuously, whose data are sent to a cloud of the Swiss IQAir manufacturer. Here a figure showing both PM 2.5 readings, with time always being UTC:
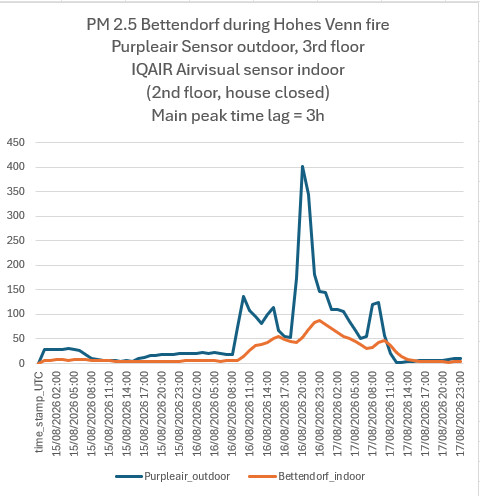
The main peak measured by the Purpleair sensor happens at 20:00 UTC, the indoor peak at 23:00. Readings are hourly means. During this time, the house was unoccupied, and all windows shut down. Nevertheless the natural ventilation was sufficient to transport the outdoor pollution indoor, albeit smoothed but curiously with a similar relative amplitude: the outdoor swing is about 20 to 400 ug/m3 (i.e. an increase by a factor 20), the corresponding indoor 4 to 87, an increase by a factor 22, close to the first one!
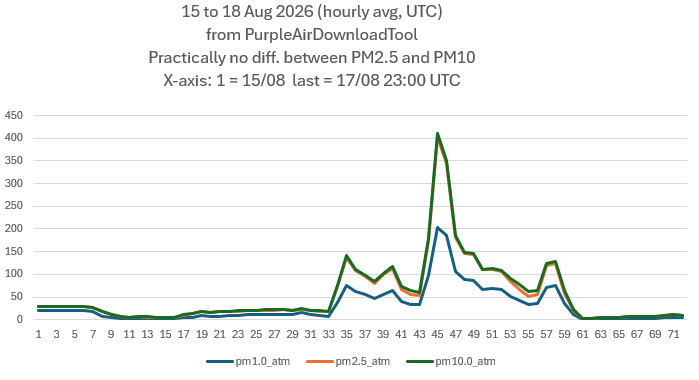
The hourly averaged Purpleair data have been retrieved by the Purpleair Download Tool; the Purpleair equipment have two Plantronic LLS detectors (the original have been replaced by new ones in 2025). I often have found that the PM 2.5 readings are very close to the PM 10, as can be seen by the following picture, that shows PM 1.0, PM 2.5 and PM 10 readings of the Bettendorf sensor:
2. The official "EMWELT" website of the Luxembourg Administration of the Environment
Since many years, the website https://environnement.public.lu/fr/loft/air/mesures/mesures-actuelles.html shows plots of many atmospheric air parameters; PM readings are only made at 4 locations, 2 in Luxembourg-City, one in Esch/Alzette (both larger cities) and one in rural Beidweiler. In my time as manager of https://meteo.lcd.lu I often made comparisons with the Beidweiler station, as the rural environment is more similar to that in Diekirch (or Bettendorf, the first a small city, the last a rural town): see here, here and here.
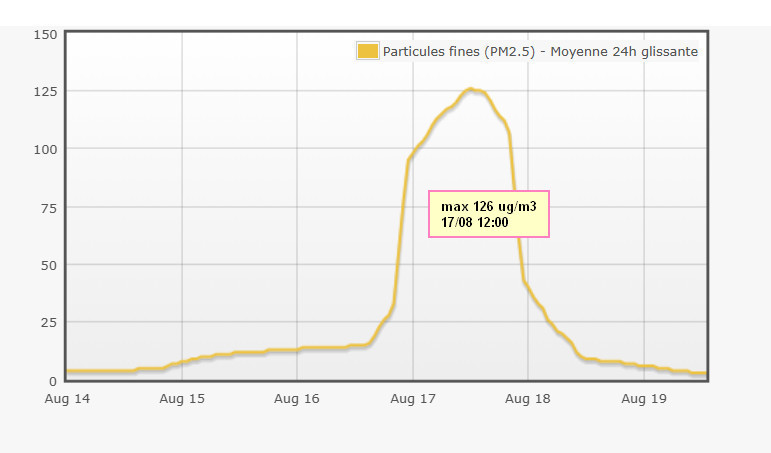
The website shows the PM10 and PM2.5 readings only as a daily average, or by applying a 24h moving average; this last choice is a very unfortunate one, as the peak timings are shifted and short-lived variations smoothed out. The following screenshot shows that the 16th August peak has shifted into the middle of the 17th August, which gives a total false impression of the real timing, and also the real amplitude.
To retrieve the hourly readings, one has to consult the European EEA Discomap data bank, which holds (among others) the PM10 readings of the 4 active stations. The Beidweiler station code is LU0105A. A special website makes the data selection much easier: one has to open the Downlaod Service at https://eeadmz1-downloads-webapp.azurewebsites.net and fill out the relevant windows, as shown below:
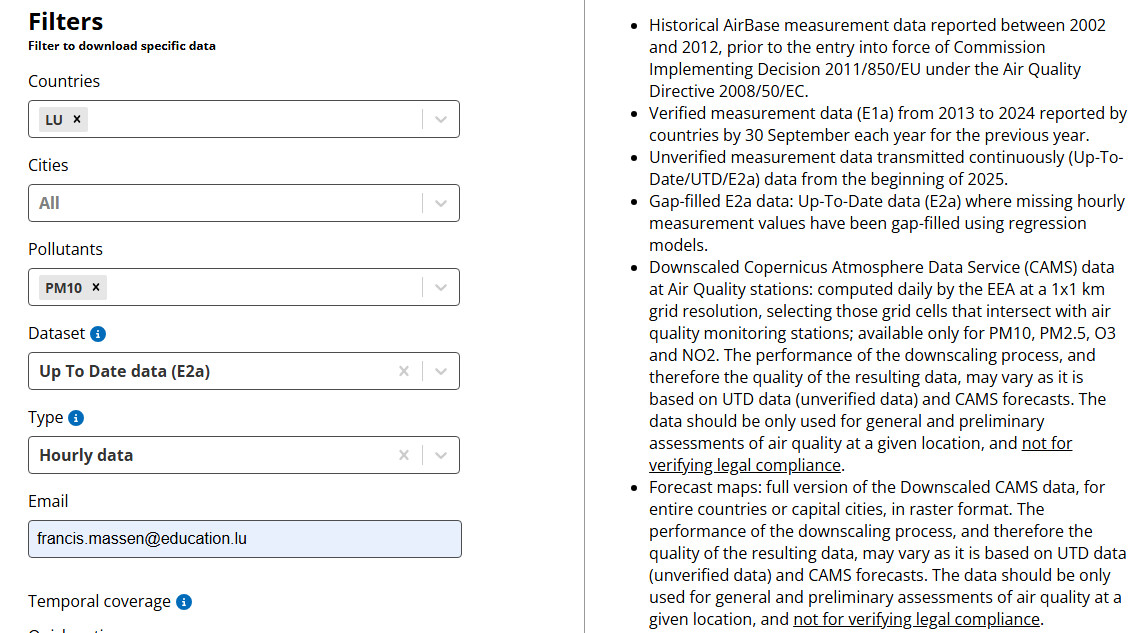
In former years, one could choose for instance a .csv format for the data. This is not possible anymore, as all data series are in the binary Apache Parquet format (extension is .parquet). Opening and converting the .parquet file into a normal .csv file is easily done by one of the many online parquet viewers ( for instance https://DataConverter.io).There is some ambiguity concerning the time-zone format: in the explanations UTC+1 is given, without mentioning if DST (daylight saving time = summer- and wintertime) also applies.
The following picture shows the PM10 readings from Bettendorf and Beidweiler (hourly averages):
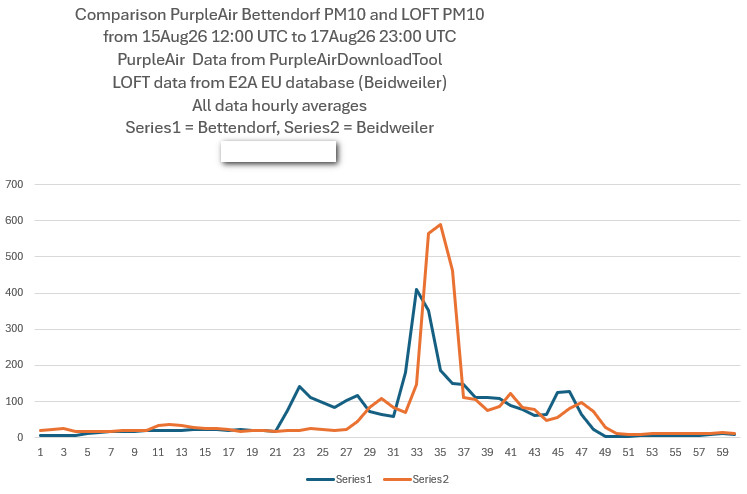
There is clearly a shift of about 2 hours between the UTC Bettendorf readings and those in the E2a database of Beidweiler; the distance between Bettendorf and Beidweiler is 16 km (Monschau in the High Fens is at a distance of 75km from Bettendorf, and 92km from Beidweiler. As the windspeed was possibly 9 km/h (from https://lcd.lu/meteolcd/) a timelag of 2 hours is possible, so that the E2a times are also UTC.
Shifting the Bettendorf curve by 2 hours to the right gives the next picture:
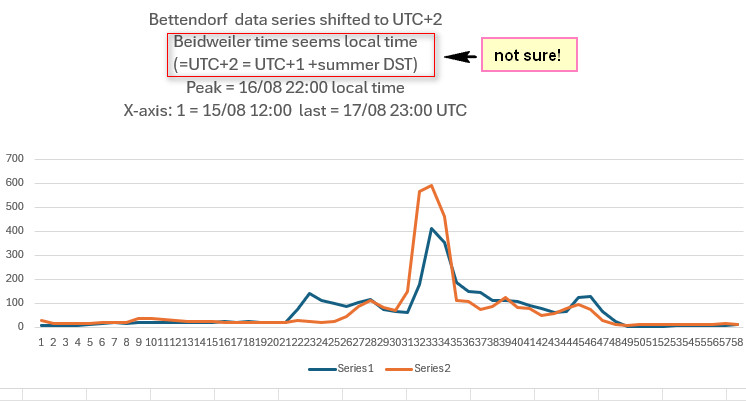
As can be seen, both the mean peak a two secondary ones do coincide in a very satisfying manner. It should be recalled that Beidweiler uses expensive Horiba equipment, whereas the much cheaper Purpleair detectors do not have any correction for humidity nor constant air pressure.
3. Conclusion
The comparison shows that the inexpensive community Purpleair equipment can give good results, that are visible in nearly real-time on the Purplelair map website, a feature that the official administration was unable to offer. The choice of using a 24 hour moving average for the official Emwelt plots is regrettable, and should be changed asap. Also the unfortunate ambiguity of the time used in the official database (is it UT+1? UTC? DST?) should be clarified by a visible statement.
There was quite some slightly hysteric reporting in the newspapers on the possible health dangers of this large High Fens fire, with speculations that the PM pollution might remain in place for a longer time. The measurements show that this was not the case: the maximum pollution peak was short-lived, and PM levels came fast down to normal background values.
_____________________________________________________________________________________________________________________________